Major trading partners – calendar year results
The NT is geographically located close to major Asian economies including Japan, China, Taiwan, Indonesia and the Republic of South Korea, and as expected these are the NT’s major trading partners. The NT also relies on goods imports from the United States of America and the European Union, which are also identified as key trading partners. In this section, analysis on the NT's major trading partners is provided by calendar year, for both exports and imports.
Japan | China | Singapore | Taiwan | Republic of Korea | Thailand | Indonesia | India | Papua New Guinea | European Union | Malaysia | Vietnam | United States of America | Canada
2025 Activity
Please note, some of the main items of trade have been confidentialised by the ABS due to sensitivity of specific commodities and limited sources of goods and merchandise, which makes suppliers easily identifiable.
Map 1: The Territory’s major goods trading partners, 20251
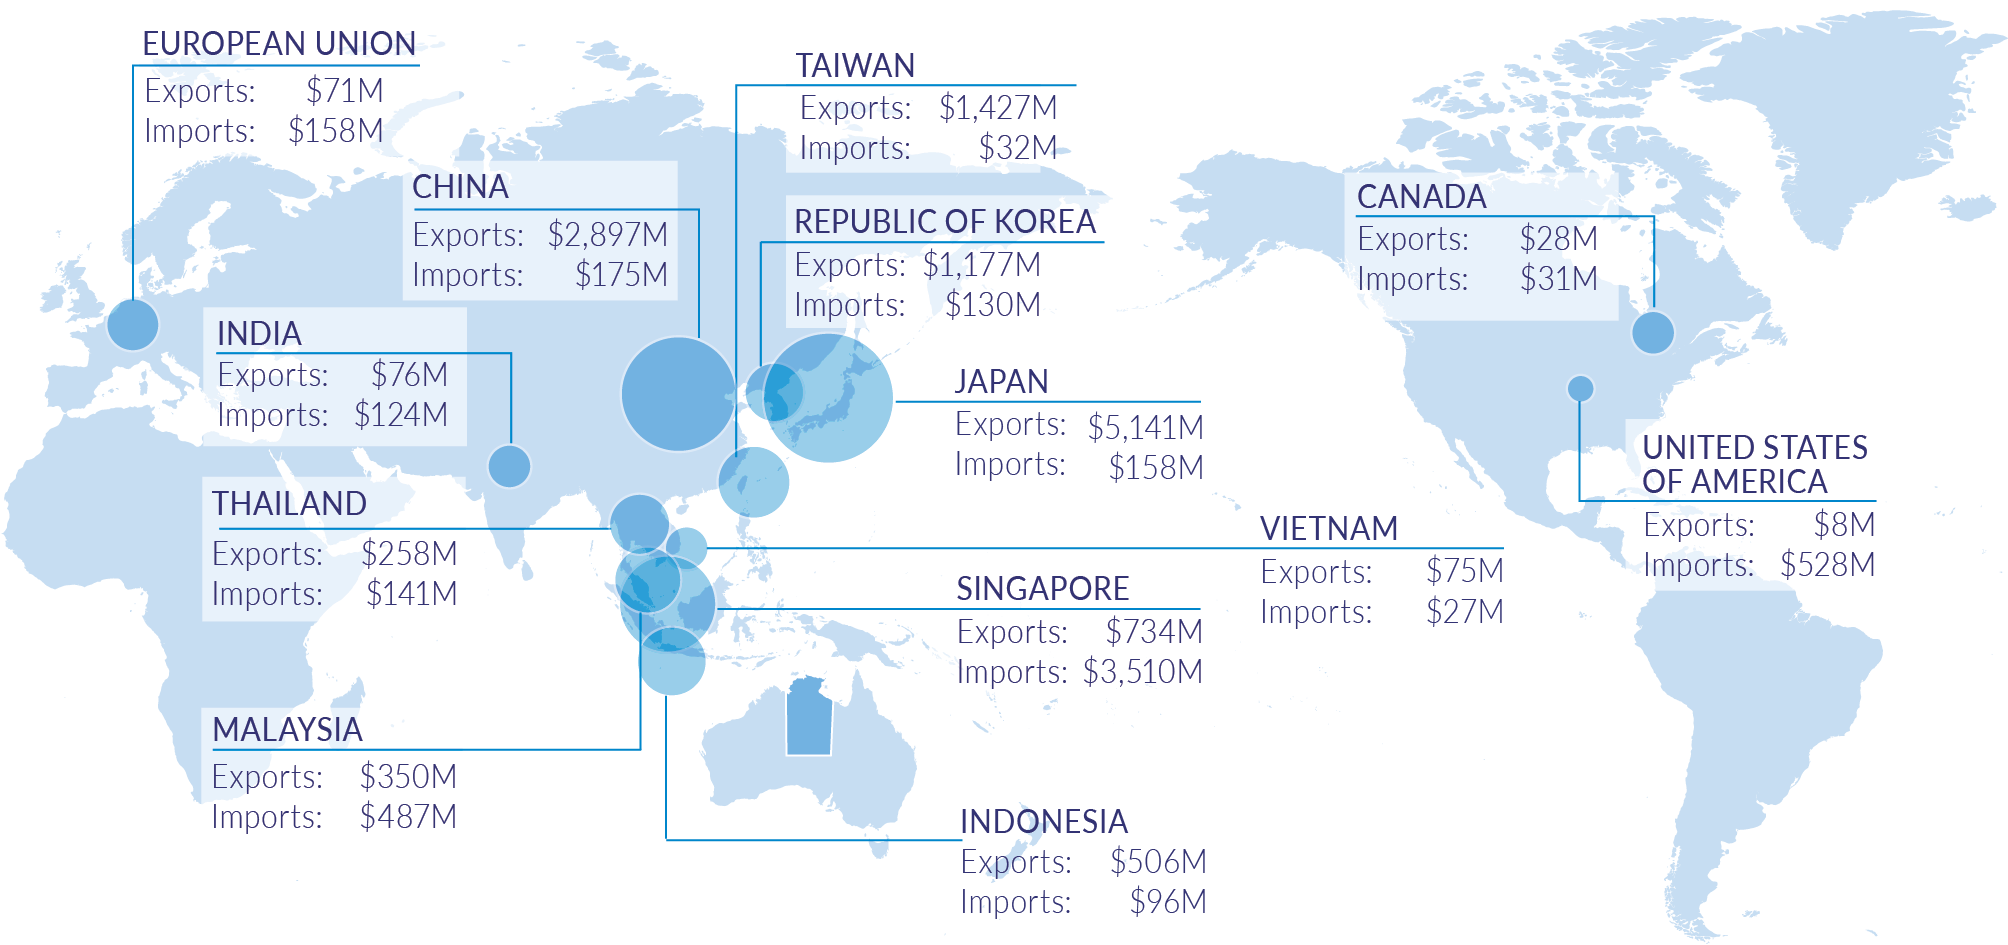
1 Current prices.
Source: Department of Treasury and Finance, ABS, International Trade in Goods
Japan
- Japan was the NT’s largest export market in 2025, representing 39.2% of the Territory’s exports. Goods exported increased by 9.2% to $5.1 billion, driven by increases in confidential items (likely liquefied natural gas).
- Goods imported increased by 4.6% to $158 million, and the share of imports was 2.7%
China
- China was the NT’s second largest export market, representing 22.1% of the Territory’s exports. Goods exported increased by $746 million to $2.9 billion.
- Goods imported declined by 27.1% to $175 million, and the share of imports was 3%.
Singapore
- Goods exported to Singapore increased by 32.0% to $734 million, driven by an increase in confidential items.
- Goods imported increased by 2.8 billion to 3.5 billion, and the share of imports was 60.4%.
Taiwan
- Goods exported to Taiwan declined by 18.7% to $1.4 billion, driven by a decline in the confidential items category (likely liquefied natural gas).
- Goods imported increased by 23.1% to $32 million, and the share of imports was 0.6%.
Republic of Korea
- Goods exported to the Republic of Korea increased by 9.9% to $1.2 billion, driven by increases in the confidential items category (likely liquefied natural gas) and petroleum and related products.
- Goods imported increased by 140% to $130 million, and the share of imports was 2.2%.
Thailand
- Goods exported to Thailand declined by 36.6% to $258 million, driven by a decline in the petroleum and petroleum related products.
- Goods imported declined by 0.7% to $141 million, driven by a decline in road vehicles.
Indonesia
- Goods exported to Indonesia increased by 19.6% to $506 million, driven by increases in live animals export.
- Goods imported declined by 63.1% to $96 million, and the share of imports was 1.7%.
India
- Goods exported to India increased to $76 million, driven by an increase in gas, natural and manufactured materials.
- Goods imported increased by 49.4% to $124 million, and the share of imports was 2.1%.
European Union
The European Union (EU) consists of 27 member states, Austria, Belgium (including Belgium Luxembourg), Bulgaria, Croatia, Cyprus, Czech Republic, Denmark, Estonia, Finland, France (including the French Antilles), Germany, Greece, Hungary, Ireland, Italy, Latvia, Lithuania, Luxembourg, Malta, Netherlands (including the Netherlands Antilles), Poland, Portugal, Romania, Slovak Republic, Slovenia, Spain and Sweden.
- Goods exported to the EU increased by 79.4% to $61 million, driven by increases in metalliferous ores and metal scrap.
- Goods imported increased by 20.6% to $158 million, and the share of imports was 2.7%.
Malaysia
- Goods exported to Malaysia increased by 89.2% to $350 million, driven by an increase in confidential items.
- Goods imported increased by 14.6% to $487 million, driven by a decline in petroleum and petroleum related products.
Vietnam
- Goods exported to Vietnam fell by 21.1% to $75 million, driven by a decline in the live animal’s category and confidential items.
- Goods imported declined by 27% to $27 million, and the share of imports was 0.5%.
United States of America
- Goods exported to the United States of America increased by 33.3% to $8 million, and the share of exports was 0.1%.
- Goods imported increased by 47.1% to $528 million, and the share of imports was 9.1%
Canada
- Goods exported to Canada fell by 44.0% to $28 million, driven by a decline in metalliferous ores and metal scrap.
- Goods imported declined from $34 million to $31 million, and the share of imports was 0.5%.