Major trading partners – financial year results
The Northern Territory (NT) is geographically located close to major Asian economies including Japan, China, Taiwan, Korea and Indonesia and, as expected, these are the NT’s major trading partners. The NT also relies on goods imports from the United States of America (USA) and the European Union (EU), which are also identified as key trading partners. In this section, analysis on the NT's major trading partners is provided by financial year, for both exports and imports.
Japan | China | Singapore | Republic of Korea | Taiwan | Thailand | Indonesia | Papua New Guinea | Malaysia | European Union | India | Vietnam | United States of America | Canada
2024-25 Activity
Please note that some of the main items of trade have been confidentialised by the ABS due to sensitivity of specific commodities and limited sources of goods and merchandise, which makes suppliers easily identifiable.
Map 1: The Territory’s Major Goods Trading Partners, 2024-251, 2
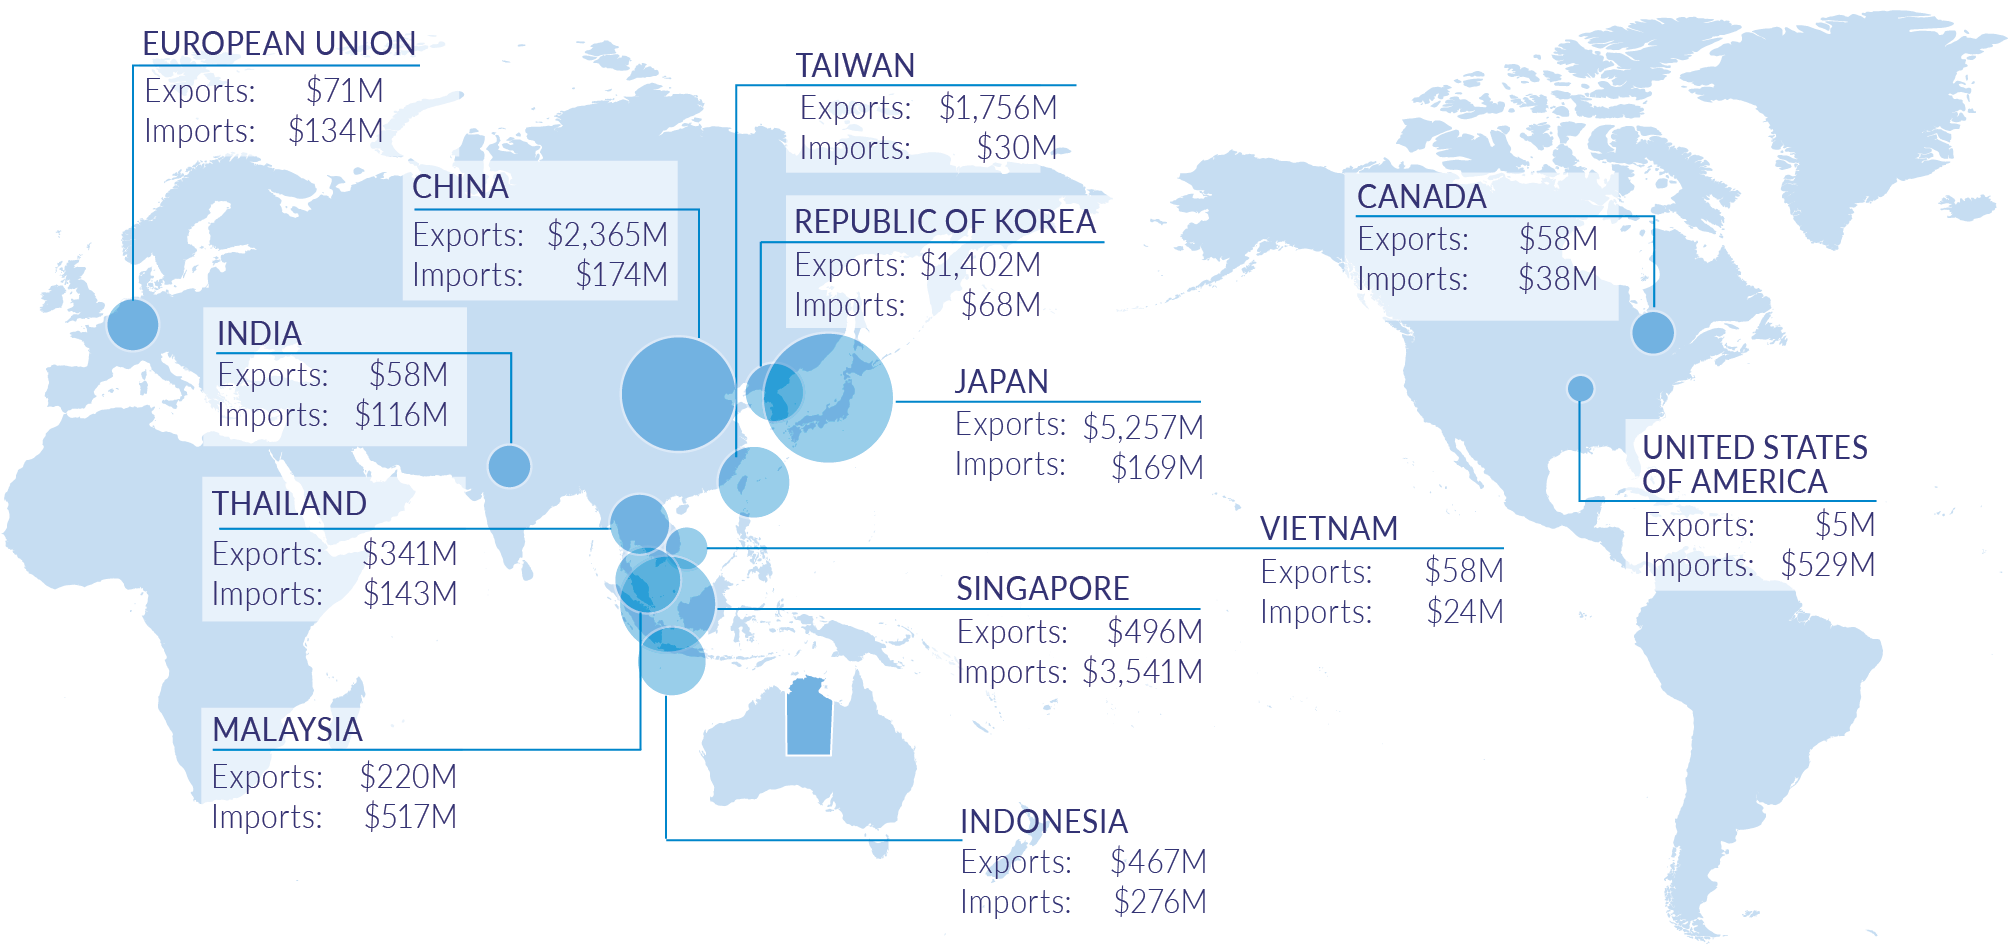
1 Current prices.
2 This map is produced from various sources. Department of Treasury and Finance cannot guarantee the accuracy, currency or completeness of the information. To be used as a guide only.
Source: Department of Treasury and Finance, ABS, International Trade in Goods and Services, Cat. No. 5368.0
Japan
- Japan was the NT’s largest export market with exports declining by 13.0% to $5.3 billion, reflecting a decline in confidential items (likely liquefied natural gas (LNG)) and petroleum and petroleum related products.
- Imported goods increased 13.4% to $169 million, driven by an increase in road vehicles and rubber manufacturers.
China
- China was the NT’s second largest export market with exports declining 17.7% to $2.4 billion, driven by a decline in confidential items
- Imported goods declined by 20.2% to $174 million, due to a decline in confidential items and general industrial machinery and equipment, and machine parts.
Singapore
- Goods exported to Singapore declined by 39.1% to $496 million, due to a decline in petroleum and petroleum related products.
- Goods imported increased from 579 million to $3.5 billion, driven by an increase in transport equipment (excluding road vehicles).
Republic of Korea
- Goods exported to the Republic of Korea increased by 59 % to $1402 million, driven by an increase in confidential items andpetroleum and petroleum products.
- Goods imported fell by 75.3% to $68 million, due to a decline in petroleum and
petroleum-related products.
Taiwan
- Taiwan was the Territory’s third largest export market with exports declining by 9.3% to $1.8 billion, reflecting a decline in confidential items (likely LNG).
- Goods imported increased by 42.9% to $30 million, driven by increase in inorganic chemicals.
Thailand
- Goods exported to Thailand declined by 16.0% to $341 million, reflecting a decline in petroleum and petroleum products, and other exports.
- Goods imported declined by 2.1% to $143 million, reflecting a decline in manufacturers of metals.
Indonesia
- Goods exported to Indonesia increased by 31.5% to $467 million, driven by increase in confidential items (likely LNG) and live animals.
- Goods imported increased from $104 million to $276 million, driven by an increase in confidential items and petroleum and petroleum related products.
Malaysia
- Goods exported to Malaysia declined by 2.2% to $220 million, reflecting a decline in confidential items and live animals.
- Goods imported increased by 6.6% to $517 million, reflecting an increase in petroleum and petroleum‑related products.
European Union
The EU consists of 27 member states, Austria, Belgium (including Belgium Luxembourg), Bulgaria, Croatia, Cyprus, Czech Republic, Denmark, Estonia, Finland, France (including the French Antilles), Germany, Greece, Hungary, Ireland, Italy, Latvia, Lithuania, Luxembourg, Malta, Netherlands (including the Netherlands Antilles), Poland, Portugal, Romania, Slovak Republic, Slovenia, Spain and Sweden.
- Goods exported to the EU declined by 65.1% to $71 million, reflecting a decline in miscellaneous manufactured articles.
- Goods imported increased 3.1% to $134 million, reflecting increases in general industrial machinery and equipment and transport equipment.
India
- Goods exported to India increased by 93.3% to $58 million, reflecting an increase in gas, natural and manufactured items.
- Goods imported increased by 17.2% to $116 million, reflecting an increase in confidential items and general industrial machinery and equipment, and machine parts.
Vietnam
- Goods exported to Vietnam declined by 38.3% to $58 million, reflecting a decline in confidential items.
- Goods imported declined by 20.0% to $24 million, reflecting increases in general industrial
United States of America
- Goods exported to the USA declined by 64.3% to $5 million, reflecting a decline in transport equipment.
- Goods imported increased by 87.6% to $529 million, reflecting an increase in transport equipment (excluding road vehicles).
Canada
- Goods exported to Canada increased by 52.6% to $58 million, due to an increase in metalliferous ores and metal scrap.
- Imported goods from Canada increased by 58.3% to $38 million, reflecting an increase in imports for metalliferous ores and metal scrap.